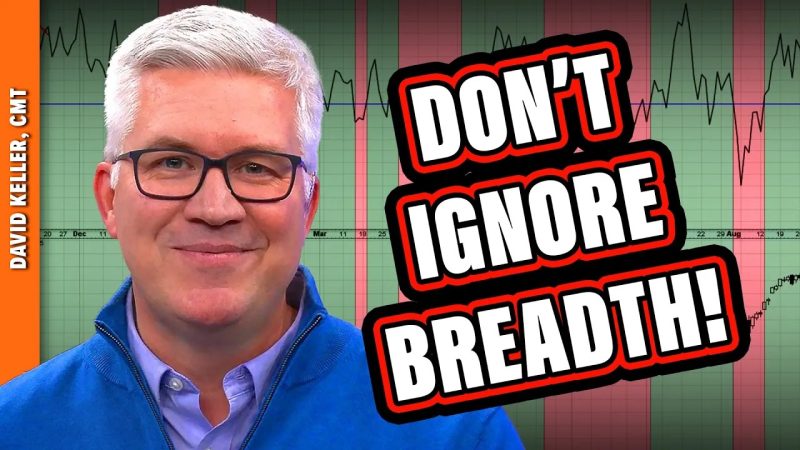
When it comes to investing in the stock market, it’s essential to use various indicators to make informed decisions. Breadth indicators play a crucial role in analyzing the overall health of the market and can help investors identify potential trends early on. In this article, we will discuss the top 5 breadth indicators that you can’t afford to ignore when evaluating the market.
1. Advance-Decline Line (A/D Line):
The Advance-Decline Line is a popular breadth indicator that compares the number of advancing stocks to declining stocks. By tracking this ratio, investors can gauge the overall market sentiment and strength. A rising A/D Line indicates that more stocks are advancing compared to declining ones, suggesting a healthy market trend. Conversely, a declining A/D Line may signal underlying weakness in the market.
2. New Highs-New Lows Index:
The New Highs-New Lows Index measures the number of stocks hitting new highs versus new lows over a specific period. This breadth indicator provides valuable insights into market breadth and helps investors identify potential shifts in momentum. A high number of new highs relative to new lows suggests a strong market, while a divergence between new highs and new lows may indicate a reversal in the market trend.
3. McClellan Oscillator:
The McClellan Oscillator is a market breadth indicator based on the difference between two exponential moving averages of advancing and declining issues. This oscillator helps investors identify overbought and oversold conditions in the market. Positive readings indicate that the market is in a bullish phase, while negative readings suggest a bearish sentiment. Traders often use the McClellan Oscillator to confirm market trends and identify potential reversals.
4. Summation Index:
The Summation Index is a breadth indicator that smooths out the fluctuations in the McClellan Oscillator to provide a broader view of market breadth. This indicator helps investors identify the overall trend strength in the market. A rising Summation Index indicates increasing bullish momentum, while a declining index may signal a weakening market trend. Traders often use the Summation Index to confirm market trends and anticipate potential market reversals.
5. Arms Index (TRIN):
The Arms Index, also known as the TRIN (Short-Term Trading Index), is a market breadth indicator that compares the ratio of advancing and declining issues to the ratio of advancing and declining volume. The Arms Index helps investors gauge the intraday market sentiment and identify potential short-term reversals. A reading above 1.0 suggests bearish sentiment, indicating selling pressure in the market. Conversely, a reading below 1.0 may signal bullish sentiment and buying interest.
In conclusion, breadth indicators play a vital role in evaluating market strength, direction, and potential reversals. By incorporating these top 5 breadth indicators into your market analysis, you can make more informed investment decisions and navigate the complex world of stock trading with greater confidence.