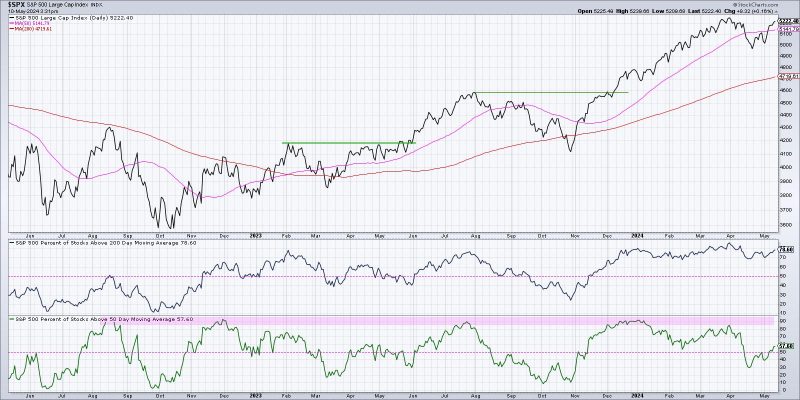
In the world of financial markets, investors are constantly seeking reliable indicators to confirm bullish trends in the market. While there are numerous tools and techniques available, three key breadth indicators are particularly useful in assessing the strength and sustainability of a bull market trend.
1. **Advance-Decline Line (A/D Line):**
The Advance-Decline Line is a widely followed breadth indicator that tracks the number of advancing stocks versus declining stocks in a particular market index. By calculating the daily difference between the number of advancing and declining issues, the A/D Line provides valuable insights into the overall health of the market. A rising A/D Line suggests that a larger number of stocks are advancing compared to those declining, indicating broad-based market strength and a bullish trend. Conversely, a declining A/D Line may signal potential weakness and a possible reversal in the market trend.
2. **New Highs – New Lows Index:**
The New Highs – New Lows Index measures the number of stocks reaching new highs versus those hitting new lows within a given period. This indicator helps investors gauge the breadth of market participation as it reflects the level of bullish sentiment across different stocks. A high number of new highs relative to new lows indicates a strong uptrend with widespread market participation, supporting the bullish case. On the other hand, a significant increase in new lows compared to new highs could signal deteriorating market breadth and potential weakness in the overall market trend.
3. **McClellan Oscillator:**
The McClellan Oscillator is a popular breadth indicator that analyzes the difference between two exponential moving averages of advancing and declining issues. By calculating this difference, the oscillator oscillates around a zero line and provides valuable insights into the internal strength of the market. Positive values indicate a bullish bias, reflecting broad participation and strong market momentum. In contrast, negative values suggest a bearish sentiment with potential weakness and a possible market downturn. Traders often look for confirmation signals, such as divergences or extreme readings, to validate the bullish trend indicated by the McClellan Oscillator.
In conclusion, monitoring these breadth indicators can help investors assess the underlying strength and breadth of a bullish market trend. By analyzing the Advance-Decline Line, New Highs – New Lows Index, and McClellan Oscillator, traders can gain valuable insights into market dynamics and confirm the sustainability of a bull market trend. Utilizing these indicators in conjunction with other technical and fundamental analysis tools can enhance decision-making and improve risk management in navigating the dynamic financial markets.
