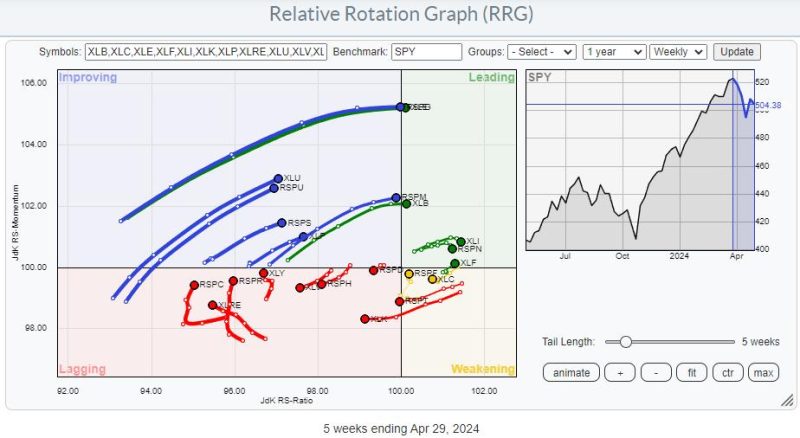
In the world of stock trading, relative rotation graphs (RRGs) have emerged as powerful tools that provide traders with a unique perspective on market trends and opportunities. By analyzing the rotation of different sectors or assets relative to a benchmark, traders can identify potential areas of outperformance and allocate their capital accordingly. In this article, we will explore the concept of RRGs and how they can be used to uncover trading opportunities in the market.
RRGs depict the relative strength of various assets or sectors compared to a benchmark, typically a market index like the S&P 500. The graph is divided into four quadrants, each representing a different combination of momentum and relative strength. Assets in the leading quadrant are showing both strong momentum and relative strength, making them attractive candidates for investment. Those in the weakening quadrant are losing relative strength but may still have strong momentum, indicating potential short-term weakness. The lagging quadrant represents assets with weak momentum and relative strength, signaling areas to avoid or consider selling short. Finally, assets in the improving quadrant are showing improving relative strength but may not yet have strong momentum, suggesting they could be poised for future outperformance.
By analyzing the rotation of assets on an RRG, traders can gain insights into the shifting dynamics of the market and make informed decisions about where to allocate their capital. For example, if a particular sector is moving from the lagging quadrant towards the leading quadrant, it may indicate a potential turnaround and present a buying opportunity. Conversely, assets moving from the leading quadrant towards the lagging quadrant could be signaling an impending decline in relative strength and prompt traders to consider reducing their exposure.
One of the key advantages of using RRGs is their ability to visualize complex relationships between different assets or sectors in a clear and intuitive manner. By observing the rotation of assets over time, traders can identify emerging trends and patterns that may not be apparent from traditional price charts. This can help traders stay ahead of the curve and capitalize on opportunities before they become widely recognized by the market.
In conclusion, relative rotation graphs are valuable tools for traders looking to uncover trading opportunities and make informed decisions in the market. By analyzing the rotation of assets relative to a benchmark, traders can identify trends, patterns, and potential opportunities for outperformance. Incorporating RRGs into their analysis can give traders a unique perspective on market dynamics and help them stay one step ahead of the competition.
