In the fast-paced world of trading and investing, having an edge can make all the difference between success and failure. While the financial markets are inherently unpredictable, there are certain indicators that traders can use to enhance their chances of making profitable decisions. In this article, we will explore two key indicators that can help improve your edge in the market.
1. Moving Averages:
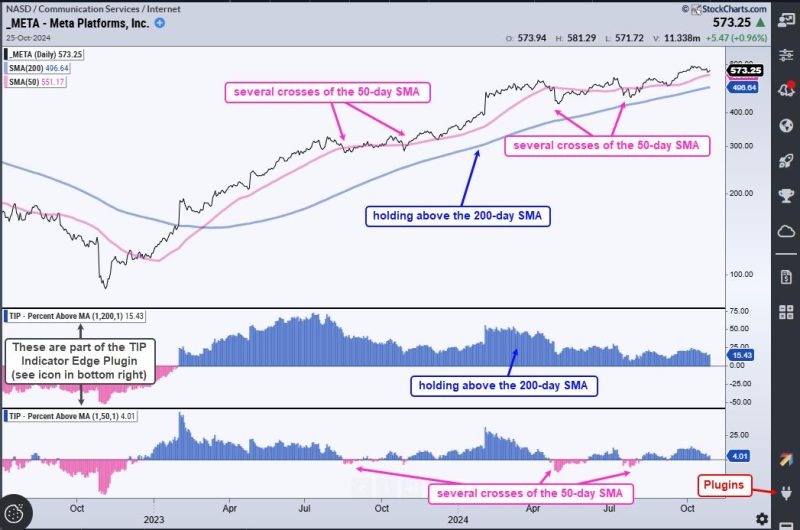
Moving averages are one of the most commonly used indicators by traders around the world. A moving average is a trend-following indicator that smooths out price data by creating a constantly updated average price. Traders often use moving averages to identify trends, as well as to determine potential support and resistance levels.
There are different types of moving averages, including simple moving averages (SMA) and exponential moving averages (EMA). Simple moving averages give equal weight to all prices within the calculation period, while exponential moving averages give more weight to recent prices.
Traders often look for crossovers between shorter-term and longer-term moving averages to signal potential changes in the trend. For example, a bullish crossover occurs when a short-term moving average crosses above a long-term moving average, indicating a potential uptrend. Conversely, a bearish crossover occurs when a short-term moving average crosses below a long-term moving average, suggesting a potential downtrend.
By incorporating moving averages into their analysis, traders can gain valuable insights into the market’s direction and make more informed trading decisions.
2. Relative Strength Index (RSI):
The Relative Strength Index (RSI) is another popular indicator used by traders to gauge the momentum of a security. The RSI oscillates between 0 and 100 and is typically used to identify overbought and oversold conditions in the market.
When the RSI exceeds 70, it is considered overbought, suggesting that the security may be due for a pullback. Conversely, when the RSI falls below 30, it is considered oversold, indicating that the security may be poised for a rebound.
Traders can use the RSI to confirm potential trend reversals or to filter out false signals. For example, if a security is making higher highs while the RSI is making lower highs, it may indicate a weakening trend and a possible reversal.
By incorporating the RSI into their analysis, traders can better understand the momentum of a security and make more precise entry and exit decisions.
In conclusion, using indicators such as moving averages and the Relative Strength Index can help traders improve their edge in the market. By combining these technical tools with sound risk management practices and a thorough understanding of market dynamics, traders can enhance their chances of success in the challenging world of trading and investing.