### The Power of Visualization in Financial Markets
#### Understanding Market Phases through Visualization:
One of the most valuable tools available to traders and investors is the ability to analyze and interpret market phases. By understanding the current market phase, one can make more informed decisions and position themselves for success. Visualizing the start of a potential distribution phase is crucial for identifying trends and potential turning points in the market.
#### Candlestick Patterns and Chart Analysis:
One effective way to visualize the start of a potential distribution phase is through candlestick patterns and chart analysis. Charting tools such as line charts, bar charts, and candlestick charts can provide valuable insights into market movements and help identify potential distribution phases. Traders can look for specific candlestick patterns such as shooting stars, evening stars, or bearish engulfing patterns to signal a possible distribution phase.
#### Volume Analysis and Accumulation-Distribution Indicator:
Volume analysis is another powerful tool for visualizing the start of a distribution phase. By analyzing trading volume alongside price movements, traders can gauge the strength of buying or selling pressure in the market. The Accumulation-Distribution Indicator is a technical analysis tool that combines price and volume to show how capital flows in and out of a security. A decrease in the indicator could signal the start of a distribution phase.
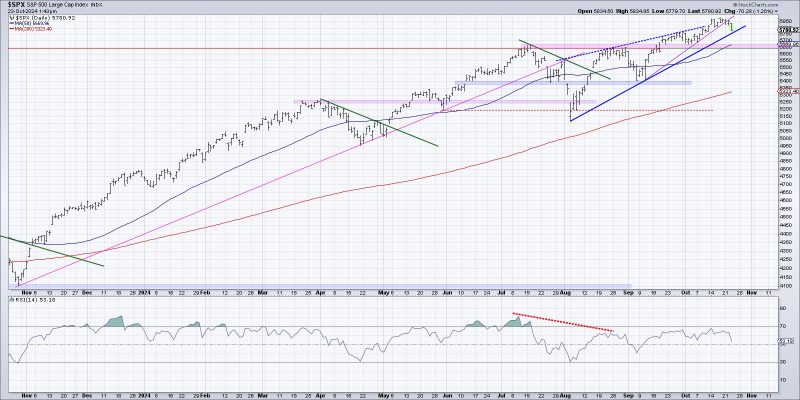
#### Moving Averages and Trendlines:
Utilizing moving averages and trendlines can also help visualize the start of a potential distribution phase. Moving averages smooth out price data, making it easier to identify trends and potential reversal points. Traders can look for crossover points between moving averages or trendline breaks to signal a shift in market sentiment towards distribution.
#### Conclusion:
In conclusion, visualizing the start of a potential distribution phase is essential for traders and investors looking to navigate financial markets successfully. By using tools such as candlestick patterns, volume analysis, moving averages, and trendlines, market participants can gain valuable insights into market phases and make well-informed decisions. Understanding and visualizing distribution phases can help traders anticipate market movements and capitalize on trading opportunities.