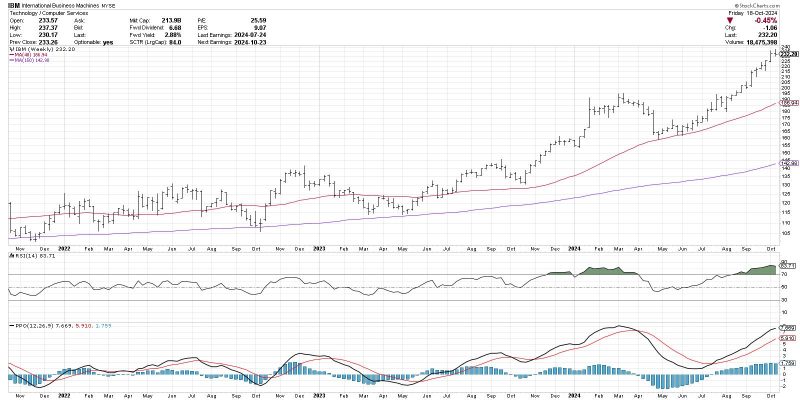
The Moving Average Convergence Divergence (MACD) Histogram is a powerful tool used by traders and analysts in financial markets to help anticipate trend changes. It offers deeper insights than the traditional MACD indicator by displaying the difference between the MACD line and the signal line in histogram form. By analyzing the MACD Histogram, traders can gain a better understanding of market momentum and potential shifts in price direction.
One key benefit of the MACD Histogram is its ability to reveal hidden divergences between price movements and the MACD indicator. Divergences occur when the price of an asset moves in one direction while the MACD Histogram moves in the opposite direction. These divergences often signal a potential reversal in the current trend, making them valuable signals for traders looking to enter or exit positions.
Another important aspect of the MACD Histogram is its sensitivity to short-term price changes. As the histogram visually depicts the difference between the MACD and signal lines, it can provide early indications of potential trend reversals or accelerations. This sensitivity can help traders stay ahead of the curve and adjust their trading strategies accordingly.
Moreover, the MACD Histogram can be used in conjunction with other technical indicators to enhance its effectiveness. By combining the signals generated by the MACD Histogram with those from indicators such as moving averages or trendlines, traders can validate potential trade opportunities and make more informed decisions.
Traders and analysts often use the MACD Histogram to identify entry and exit points in the market. When the histogram crosses above the zero line, it signals a bullish momentum, indicating a potential buying opportunity. Conversely, a crossover below the zero line suggests bearish momentum and a possible selling opportunity.
In conclusion, the MACD Histogram holds the secret to anticipating trend changes by providing valuable insights into market momentum and potential reversals. Traders who incorporate this tool into their analysis can gain a competitive edge in navigating the complexities of financial markets and making more informed trading decisions. By leveraging the power of the MACD Histogram alongside other technical indicators, traders can enhance their trading strategies and improve their chances of success in the dynamic world of investing.
