Market Sentiment Indicators: Understanding the Signs of a Bearish Phase
Technical analysis plays a crucial role in predicting the direction of financial markets, offering traders valuable insights into potential market trends. Among the myriad of indicators used by analysts and traders, market sentiment indicators are particularly important in gauging the mood of investors. In the current economic climate, where uncertainty looms large and global events impact financial markets, it is vital to understand and interpret these sentiment indicators to make informed trading decisions.
The Relative Strength Index (RSI) is a widely used technical indicator that measures the speed and change of price movements. A reading above 70 indicates an overbought condition, suggesting that the asset may be due for a price correction. Conversely, a reading below 30 indicates an oversold condition, possibly hinting at a buying opportunity. In the context of the current market scenario, if the RSI for major indices or individual stocks has consistently been above 70, it may signal an impending bearish phase as investors start to take profits and market sentiment turns negative.
Another key sentiment indicator is the Put/Call Ratio, which compares the trading volume of put options to call options. A ratio above 1 suggests that investors are buying more puts (betting on a decline) than calls (betting on a rise), indicating a bearish sentiment in the market. In times of heightened uncertainty or negative news flow, the Put/Call Ratio tends to spike, reflecting increased hedging activity by market participants. Monitoring this ratio can provide valuable insights into market sentiment shifts and potential downside risks.
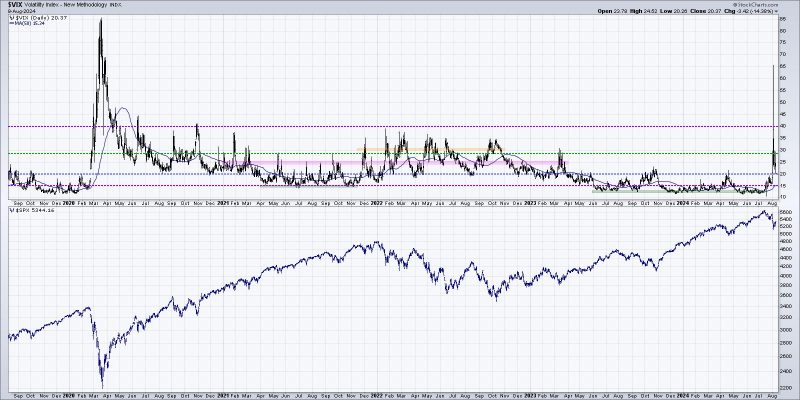
The Volatility Index (VIX), commonly known as the fear gauge, measures market expectations of future volatility. A rising VIX indicates heightened fear and uncertainty among investors, which often accompanies a bearish market phase. During periods of market turbulence or economic instability, the VIX tends to surge as investors rush to protect their portfolios from potential losses. Traders closely watch the VIX as a leading indicator of market sentiment, as spikes in volatility typically precede sharp market declines.
In conclusion, understanding and analyzing market sentiment indicators are essential for navigating volatile market conditions and making informed investment decisions. By monitoring indicators like the RSI, Put/Call Ratio, and VIX, traders can gain valuable insights into investor sentiment and market trends. As we navigate through uncertain times, staying attuned to these indicators can help traders anticipate market movements and position themselves appropriately in response to changing sentiment dynamics.